Tourwriter Zoho Analytics Integration
Tourwriter has partnered with Zoho Analytics allowing you to visualise your Tourwriter data with a sophisticated business intelligence tool. Through Zoho Analytics integration, you can work with your Tourwriter data to generate reports and dashboards once we create a workspace for you. You can go through the Zoho Analytics help files to learn more about creating Reports and Dashboards. You can also go to DataSources and add custom visualisations to your workspace. For information regarding pricing and support around Zoho Analytics, please refer to the Integrations section in our Terms & Conditions.
Join Alper for a webinar on Tourwriter’s integration with Zoho Analytics. Learn about the default Views (Reports and Dashboards) that come with your Tourwriter workspace. Analyse your Tourwriter data and learn about the underlying Tourwriter tables and queries using which you can design new reports and dashboards from scratch.
Each workspace is connected to your Tourwriter data, enabling real-time data customisation that syncs every 3 hours.
Entities in Analytics
Let’s take a look at some entities within Analytics:
- Workspace: A workspace encompasses your reports & dashboards. Your Tourwriter data which will be linked to Analytics is available in a Workspace. Tourwriter provides an initial workspace for your organisation by creating a subset of your data in the form of Tables , Queries & Reports. Tourwriter further controls access to this workspace through Roles and Permissions.
- Dashboards: Dashboards give you an overview of your Key Performance Indicators (KPIs). Your workspace comes with 4 default dashboards.
- Reports: Reports let you create visualisations. Customise your reports to present data in different chart types. Your workspace comes with 10 Standard reports and 5 charts.
- Data: Your workspace also provides a subset of your Tourwriter data in the form of Tables & Queries. Tables present information in a row-wise format.
- Tables: Analytics lets you create reports by capturing data from your Tourwriter organisation. You can create a new report or tweak your existing report by joining multiple tables. The data from your Tourwriter organisation made available through four default tables are explained in the Workspace Data section. The Query Table option in Analytics lets you achieve just that.
- Queries: You can combine one or more tables from your workspace to create customised reports using standard SQL Select queries.
- Import Data: You can add data to the workspace. Analytics lets you add, say, a google sheet, excel sheet or other data available on a cloud platform. To add data, head to Analytics Home and select Import your Data. With the new imports, you can create visualisations different from ones available in your Tourwriter workspace.
Signing up to Zoho Analytics
As soon as you agree to the 7-day free trial, you receive a Welcome to Zoho email requesting you to confirm your email. Before you confirm your email, sign-up to Zoho to ensure the Data Centre you choose is the same as the one the Tourwriter staff is on. Only then would you have access to the workspace. Here are the steps to sign-up and choose the correct Data Centre:
- Before confirming your email address, access the Zoho Analytics sign-up page: https://www.zoho.com/r/signup.html
- Enter the email address you received the email on.
- Choose a strong password.
- Click Change Country
- Select United States as the Country and Alabama as the Region.
- Agree to the Terms of Service and Privacy Policy after going through it.
- Click SIGN UP FOR FREE.
Closing your account to sign up again
If you already have signed-in and do not have access to the workspace, close your account and sign up again. Here are the steps:
- On your Analytics account, click the Profile pic in the top-right corner and select My Account
- Under Settings, in the left panel, select Close Account.
- Once your account is closed, go to https://www.zoho.com/r/signup.html and sign up again. Follow steps 1 through 7 in Signing up to Zoho Analytics.
Note: Ensure you change the Country/Region to United States and Alabama before you sign up as detailed previously.
Roles within Analytics
Analytics deploys role-based access management. There are different User Roles in Analytics. Let’s take a look at them.
- Workspace admin – A workspace admin is ideally a Tourwriter staff who manages the workspace. They have control over the workspace settings, which include managing users, creating/modifying reports and dashboards and so on. They can assign the User role to a member of your organisation and further choose to forward shared data with other users in your organisation.
- User -. A user has permission to view Dashboards/Reports that are shared with them.
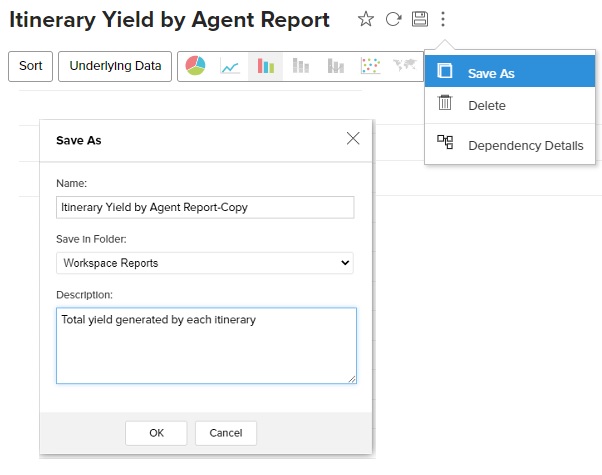
- Copying data– Although a user cannot directly modify reports and dashboards shared by the workspace admin, they can create copies. To create a copy, open a report or a dashboard and click the Options menu (three vertical dots) to see more. Select Save As to expand the Save As window. The name defaults to the original name and the suffix -Copy. Select the folder to store the new copy in the Save in Folder dropdown. Add an optional Description and click OK to save the changes.
- View access – A user with View access does not consume a user licence and has Read-only access to reports/dashboards shared with them.
Note: Tourwriter creates one user per organisation for the Integration plan at USD $20 per month. . A user is designated the User role at the beginning. To create additional User roles, please reach out to us. (This will be at additional costs).
Standard Visualisations in your Workspace
Your workspace presents visualisations by aggregating information from your database. Data from your database is available in tables in rows and columns format.
Workspace Data
Your workspace comes with standard Reports and Dashboards that are fetched from tables stored in your workspace. These tables are synced from your actual Tourwriter organisation based on your sync preferences set in your workspace. The table stores information as below:
- Itinerary Detail: An overall view and a summary of all your itineraries.
- Purchase Item Detail: A detailed information on all purchases that are made within the itineraries
- Supplier Rates Detail: All information regarding a supplier and its products
- Passenger Detail: The travellers details within the itineraries.
Configuration & Sync settings
Data in your Analytics workspace syncs with your Tourwriter organisation every 3 hours. Talk to us if you wish to sync your Tourwriter data every few hours. You can also go to DataSources and add custom visualisations to your workspace.
Standard Reports
Let us go through some of the default reports available in your workspace.
- Airport Transfer Report: Track your airport transfer operations by using the keyword “airport” in the product name
- Client Details Report: Get a birds-eye-view of all of your clients on a per itinerary basis
- Client Location Report: View the location of your travellers at any given moment
- Client Profit Report: Understand your profitability on a per-client basis
- Flight Details Report: View the flight details within your itineraries at any given moment
- Itinerary Turnaround Time Report: Track the turnaround time from itinerary creation to itinerary publishing (privately sharing)
- Itinerary Value Report: Understand the value of your itineraries, easily filtered by Itinerary Designer, Date, Status and more
- Itinerary Yield Report: Understand the overall value of your itineraries, conveniently organised by Itinerary Designer and currency
- Supplier Bookings Report: View a list of all bookings for any given supplier/s on a per itinerary basis
- Suppliers Details Report: Get a birds-eye-view of all of your suppliers and their contact details
Available charts…
- Customer Arrival Chart
- Itinerary Gross Amount Chart
- Itinerary Yield Chart
- Supplier Purchase Chart
- Supplier Sales Chart
Note: To create your charts in Analytics, refer to How to create Charts.
Standard Dashboards
Dashboards combine your reports and present a single customisable layout. Dashboards give you an overview of your Key Performance Indicators through widgets. It also allows you to combine multiple reports into a quick overview. To learn more about creating Dashboards, refer to the Zoho Help file. Your default dashboard comes with the following pre-loaded dashboards:
- Customer Dashboard: All the data regarding customers
- Sales and Profit Dashboard: Itinerary Sales and Profit Data
- Supplier Dashboard: All Supplier and Products Data
- User Dashboard: User Performance Dashboard
Drilling down data
Using the drill-down feature, you can dive deeper into your data and gather useful insights using a specified path. This drill-down path is a sequential list of data columns from your data tables. To drill-down, you can click on any point on a bar in the report, and visualise the underlying data as a new report. Refer to steps in How to drill down your data to learn more.
 Previous Post
 Next Post


